
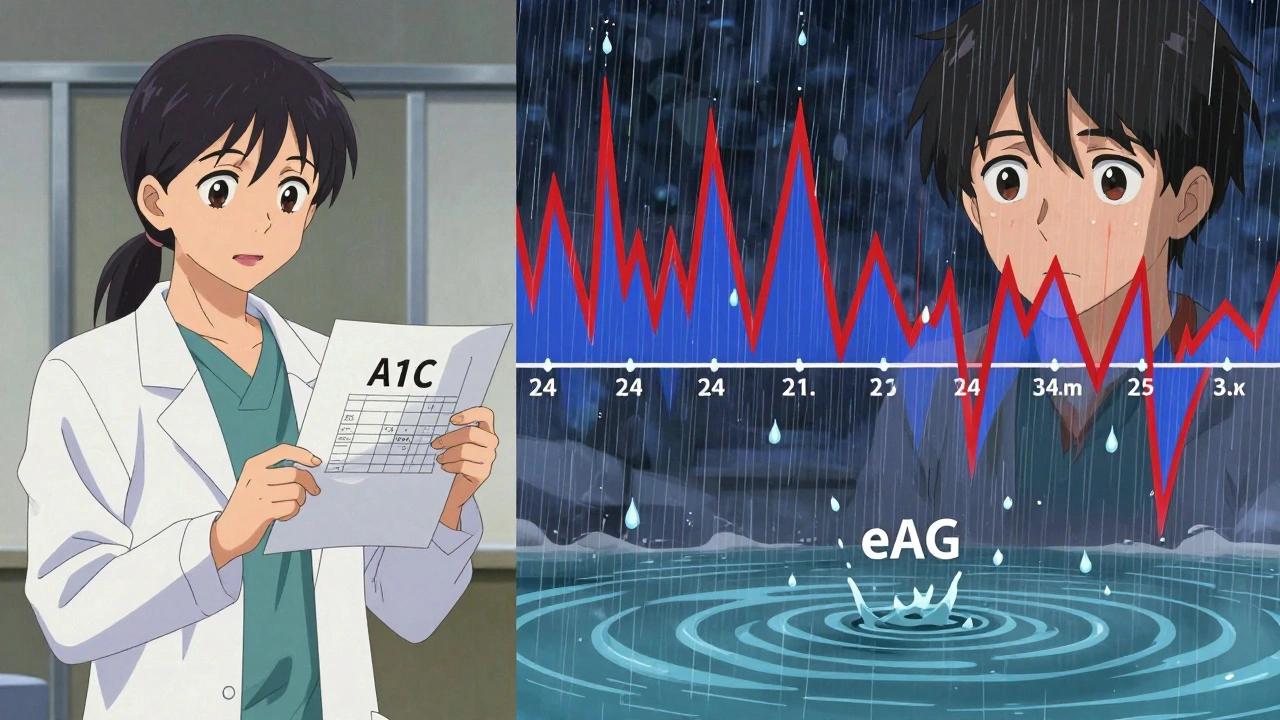
Why Your A1C Number Doesn’t Tell the Whole Story
You get your A1C result back: 7.1%. Your doctor says you’re doing well. But your glucose meter shows spikes over 200 mg/dL after meals and drops below 60 mg/dL at night. You’re confused. Why does your A1C look good when your daily numbers feel chaotic?
This is more common than you think. A1C is a powerful tool-but it’s not a complete picture. It’s like looking at a season’s batting average in baseball. If you hit .300, you’re a solid hitter. But that doesn’t tell you if you struck out in the 9th inning of Game 7, or if you got a home run every other game. A1C averages your blood sugar over 2-3 months. It smooths out the highs and lows. And that’s exactly where the problem starts.
What A1C Actually Measures
A1C, or HbA1c, is a lab test that measures how much glucose has stuck to your red blood cells. Red blood cells live for about 120 days. As they circulate, glucose in your blood attaches to them. The more glucose you have, the more sticks. That’s what A1C captures: the average amount of glucose your blood cells have been exposed to over the past few months.
It’s not affected by what you ate yesterday or whether you skipped breakfast. That’s why it’s so useful. No fasting. No stress. Just a simple blood draw. The American Diabetes Association (ADA) uses A1C ≥6.5% as the official cutoff for diagnosing diabetes. For most adults with diabetes, the target is under 7.0%. But that target isn’t one-size-fits-all. For older adults or those with heart disease, 7.5% might be safer. For younger people with type 1 diabetes, aiming for 6.5% or lower is often recommended.
Here’s the math behind it. The ADA uses this formula to convert A1C to estimated average glucose (eAG): 28.7 × A1C - 46.7 = eAG. So:
- A1C 6.0% = 126 mg/dL
- A1C 7.0% = 154 mg/dL
- A1C 8.0% = 183 mg/dL
- A1C 9.0% = 212 mg/dL
That’s helpful. But here’s the catch: this formula was built from data collected from people who checked their blood sugar 7-8 times a day for 3 months. Most people don’t do that. So the real average glucose you see on your meter might not match your A1C.
What Average Glucose Really Means
Average glucose is what you see on your glucose meter or continuous glucose monitor (CGM). If you check your blood sugar 4 times a day for a week, you can calculate the average. But that’s just a snapshot. A CGM gives you 288 readings a day. That’s way more accurate.
That’s where GMI comes in-Glucose Management Indicator. It’s the CGM version of eAG. Instead of using a formula based on A1C, GMI calculates your average glucose directly from your CGM data using the same math: GMI (mg/dL) = 12.71 + 4.70587 × mean glucose. The result? A number that matches your daily experience.
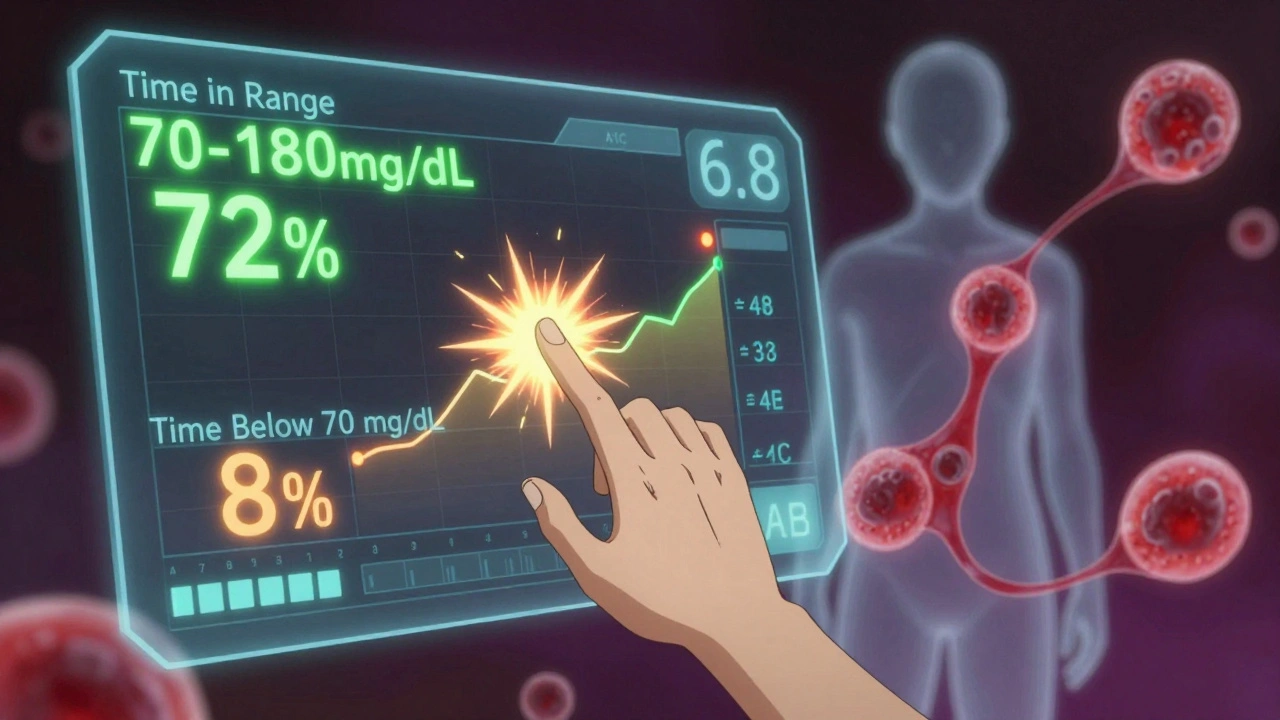
Here’s the big difference: A1C is a backward-looking lab test. GMI is a real-time, data-rich summary from your monitor. If your CGM shows you’re spending 8% of your day below 70 mg/dL, your GMI will reflect that. Your A1C? It might still say 6.8%. That’s because the lows are averaged out with the highs.
When A1C Lies to You
A1C can be misleading. It doesn’t show you how wild your numbers swing. You could have perfect A1C but spend half your day in hypoglycemia and the other half in hyperglycemia. That’s called glycemic variability-and it’s dangerous.
A 2021 study of over 5,700 people found that many with A1C under 7% had frequent low blood sugars. One user on Diabetes Daily wrote: “My A1C was 6.8%, but my CGM showed I was below 70 mg/dL for 8% of the time. My doctor didn’t see it because he only looked at the A1C.” That’s not rare. In fact, a 2021 survey by Diabetes Sisters found that 31% of people said their providers missed hypoglycemia because their A1C was “in range.”
And it’s not just lows. Some people have high post-meal spikes that don’t show up in A1C because they’re short-lived. One user reported: “My meter average was 140 mg/dL, but my A1C was 7.2%. The eAG calculator said 154 mg/dL. Turns out, I was hitting 220 mg/dL after dinner every night.” That’s the hidden cost of averaging.
Why Both Numbers Matter Together
The best approach isn’t choosing between A1C and average glucose-it’s using both.
Think of A1C as your annual report card. It tells you if you’re generally on track. GMI or your CGM average is your weekly progress report. It shows what’s happening right now.
Doctors are starting to use both. The American Association of Clinical Endocrinologists now recommends looking at:
- Time in Range (70-180 mg/dL): Aim for at least 70% of the day
- Time below 70 mg/dL: Keep it under 4%
- Time above 180 mg/dL: Keep it under 25%
These numbers come from CGM data. A1C still matters-but now it’s a backup. If your GMI says 160 mg/dL and your A1C is 7.5%, something’s off. Maybe your red blood cells are living longer due to iron deficiency. Or maybe you’ve had recent blood loss. A1C can be wrong in people with anemia, kidney disease, or certain blood disorders.
A 2023 study from the T1D Exchange registry found that using both A1C and GMI reduced treatment errors by 23%. That’s huge. It means fewer missed lows, fewer unnecessary insulin changes, and better outcomes.
What You Should Do Right Now
If you’re not using a CGM, start tracking your glucose 4 times a day for at least 3 weeks. Write down your numbers: before meals, after meals, at bedtime, and if you feel low. Calculate your average. Then compare it to your last A1C.
If your average glucose is much higher than your eAG (calculated from A1C), you’re likely having big spikes. If it’s lower, you might be having lows that your A1C hides.
If you have a CGM, look at your 14-day report. Don’t just glance at the average. Look at the graph. How much time are you spending below 70? Above 180? Are your highs happening after dinner? Are your lows happening at 3 a.m.?
Take that report to your doctor. Say: “I want to understand how my daily numbers connect to my A1C.” Don’t let them just say, “You’re good.” Ask: “Is my Time in Range where it should be? Are my lows being ignored?”
What the Future Holds
By 2027, experts predict Time in Range will replace A1C as the main target for diabetes care. A1C won’t disappear-it’ll become a secondary check. The FDA has already approved clinical trials to use TIR as the primary outcome. That’s a major shift.
Why? Because we now know that glucose variability matters as much as average levels. Fluctuations damage blood vessels. They increase heart disease risk. A1C can’t see that. CGM data can.
For now, you’re stuck with both systems. But you don’t have to be confused. Use A1C to see the big picture. Use your average glucose to fix the daily problems. One tells you where you’ve been. The other tells you where you need to go.
Quick Reference: A1C to eAG Conversion
| A1C (%) | eAG (mg/dL) |
|---|---|
| 5.0 | 97 |
| 6.0 | 126 |
| 7.0 | 154 |
| 8.0 | 183 |
| 9.0 | 212 |
| 10.0 | 240 |
| 11.0 | 269 |
| 12.0 | 298 |
What to Ask Your Doctor
- What’s my current A1C, and what’s my estimated average glucose (eAG)?
- Do I have a CGM report? Can we look at my Time in Range and time below 70 mg/dL?
- Is my A1C consistent with my daily glucose readings? If not, why?
- Based on my lifestyle and health, what’s my personal A1C target?
- Are my lows being tracked, or is my A1C hiding them?


Saket Modi
December 3, 2025 AT 07:50